Accessing DITA Publish and Preview Logs


Prerequisites:
  • For debug details and temp folders, system administrators must enable debug mode (args.debug) before users run DITA publishes or previews. See Running DITA Debug Mode for details.

    Note
    The system provides debugging details in the DITA log after the associated DITA-OT transformation runs with debug mode enabled.
  • Users must execute a DITA publish or preview to generate the DITA log.


Access log data about publishes and previews executed on DITA content.

Log data includes details about the following:

  • DITA-OT parameters applied at publish or preview time.

  • DITAVALs applied at publish or preview time.

  • The output format applied at publish or preview time.

  • Any errors that occurred during the DITA-OT transformation process.

To access DITA logs:

  1. Navigate to Administration > Publishing Monitor.

    The Publishing screen displays.

  2. If you recently executed the DITA publish, watch the DITA-OT transformation log entries generate in real-time by completing the following steps.
    1. Select Show Detailed Status in the Post Processing area.

      View Detailed Post Processing Status

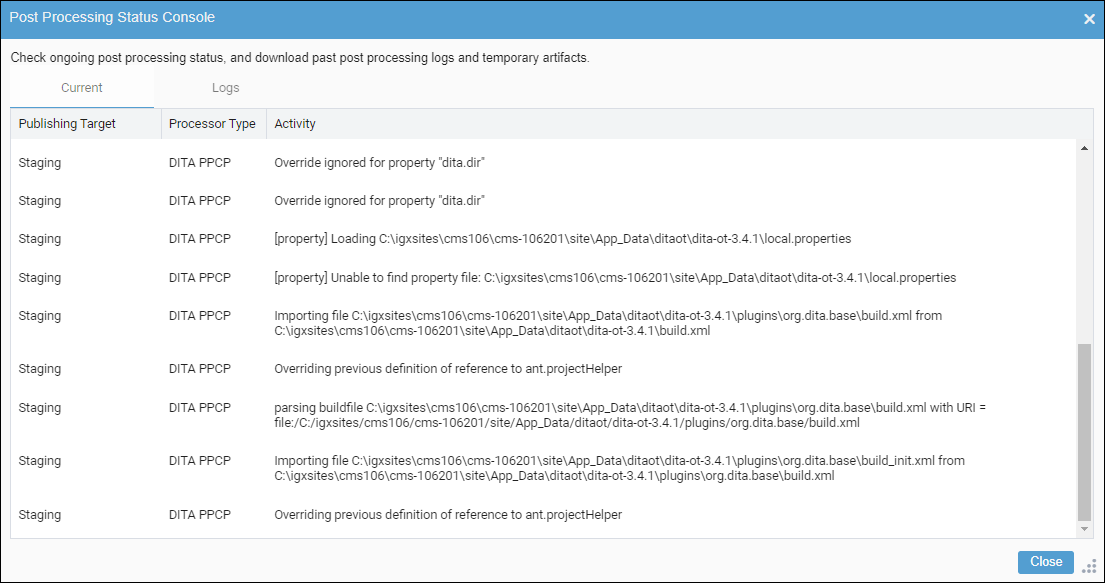
      The Current tab of the Post Processing Status Console dialog displays. You can review the log entries as the system generates them.

      Post Processing Status Console Dialog > Current Tab

    2. You can select the Logs tab to access all DITA logs in addition to the most recent log.
  3. If you did not follow the optional step above, then select the Show DITA Logs button in the Recently Completed section of Publishing Monitor to access the logs.

    Show DITA Logs Button

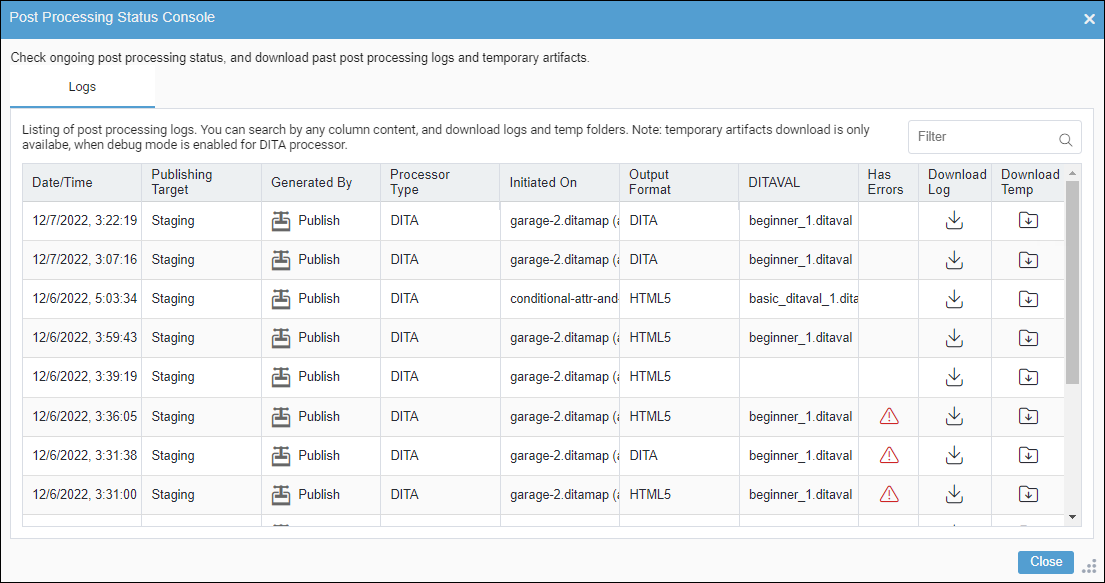
    The Logs tab of the Post Processing Status Console dialog displays the following details.

    Data Type

    Description

    Date/Time

    The date and time when the DITA log generated.

    Publishing Target

    The publishing target associated with the executed DITA publish or preview.

    Generated By

    This column indicates whether the system generated the log from a DITA publish or DITA preview.

    Processor Type

    The processor type used (e.g., DITA) for the post-publish processing.

    See Content Processors for details about post-publish content processors.

    Initiated On

    The DITA map asset where the user executed the DITA publish or preview.

    Output Format

    The output format used at DITA publish or preview time.

    See Configuring DITA Open Toolkit Output Formats for details about DITA-OT output formats

    DITAVAL

    The DITAVAL used (if applicable) at DITA publish or preview time.

    See DITAVAL Management for details about DITAVALs and conditional processing.

    Has Errors

    This column indicates whether the post processing encountered fatal errors.

    Important

    The Has Errors column only indicates conflicts when the transformation process encounters errors that halt the entire process. If the Has Errors column indicates no conflicts, the log may still contain errors and warnings that did not halt the transformation process.

    See DITA Publish Log Entries Flag Errors for details to troubleshoot DITA log errors.

    Download Log

    Select the icon within this column to download the DITA log to your local machine.

    Important

    DITA logs only provide debug details when debug mode is enabled.

    Download Temp

    Select the icon within this column to download a zipped file of the DITA temp folder to your local machine.

    Troubleshooting

    DITA logs only provide temp folder downloads when debug mode is enabled. Without debug mode, the DITA-OT automatically deletes the DITA temp folder contents after the transformation process runs. Users can only download DITA temp folders after the associated DITA-OT publish runs with debug mode enabled.

    Post Processing Status Console Dialog > Logs Tab