Analytics Tab
The Analytics tab provides the page's analytic summary, reports, and content analysis.
Report Range displays analytics data within a specific time frame.
To set a region range:
Content Summary
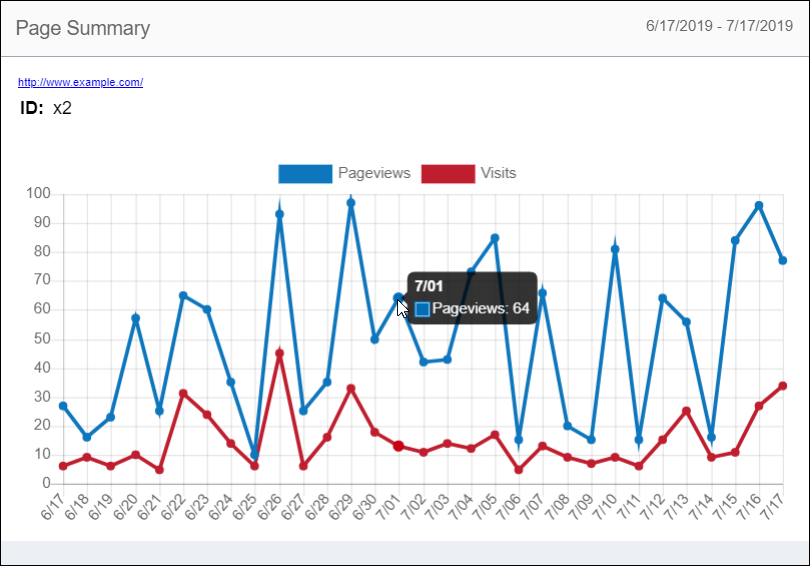
Page Summary provides a line chart of the page's daily visits and page
views.
To view a specific chart statistic:
Page Reports
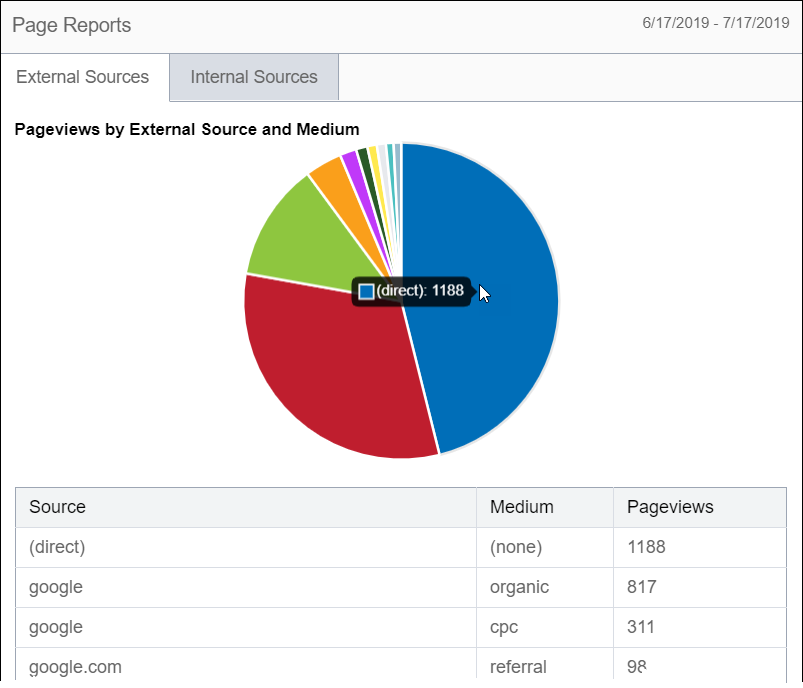
Page Reports provides a pie chart of external and internal sources for page views.
The Page Reports list displays the page view source, medium (e.g., organic, referral),
and total page views per source.
To view a specific pie chart statistic:
Content Analysis
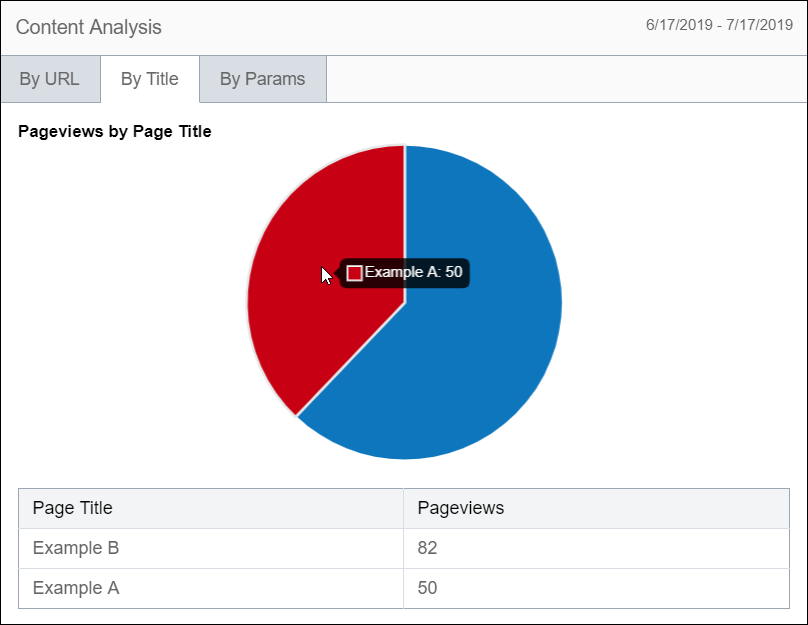
Content Analysis provides pie charts of page views by requested paths, page
titles, and paths including query string parameters.
To view a specific pie chart statistic:
Enabling Analytics
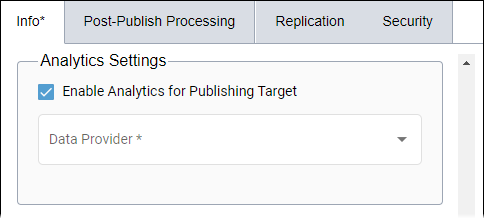
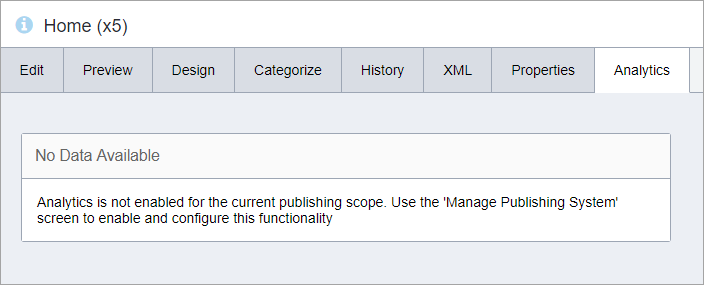
After navigating to tab, you may encounter the No Data Available message. This means that you
need to enable analytics before you can configure it.
To enable and configure analytics:


