Monthly Production
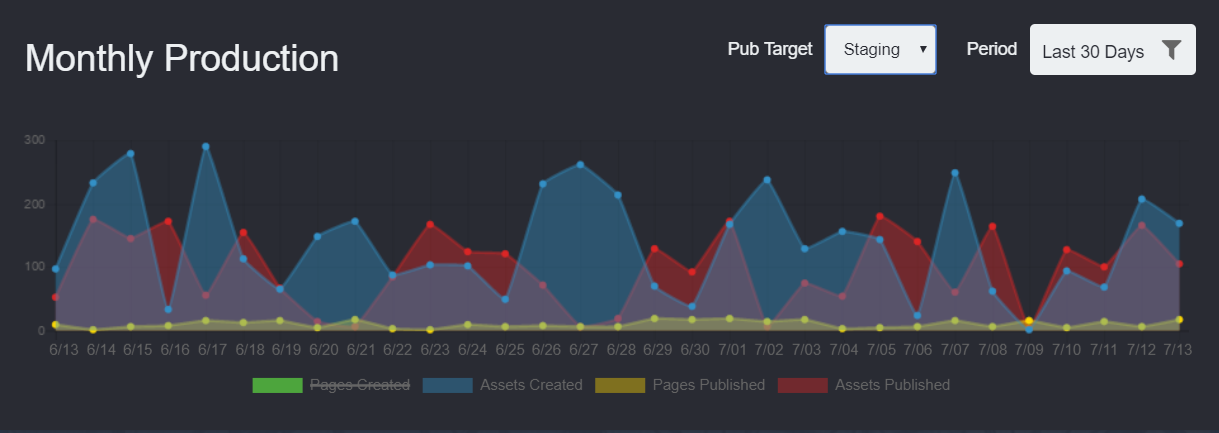
This layered area chart provides a way to compare monthly production trends so that you can make data-driven decisions. For example, you could use this feature to compare the number of created pages with published pages. If your daily page creation figure consistently exceeds the number of pages published, this may indicate that your contributors are using pages as drafts rather than relying on versioning.

For production data to display, the Pub Target drop-down list provides different publishing target options, and the Period field filters the time period.
To display individual stats for a specific day of the month:
- Hover over any x-y coordinate marked with a dot. The stat displays in a callout box.
To hide layers:
- Locate the legend immediately below the area graphics.
- Click one or more entries that you want to hide. The system hides selected entries from view.
To display layers:
- Click the entry or entries that you want to display. The entry displays.
