Ingeniux AI Module 2 Dashboard
Prerequisites:
- Users must have group permissions to access the Apps pane. See Creating Groups for details to set permissions.
- Users with permissions must activate the Ingeniux AI system with either Ingeniux default access or with a private ChatGPT key. See Configure AI Application for details.
Users with permissions can view the Ingeniux AI module 2 app's Dashboard tab to review AI usage metrics and user activity. To access the dashboard, navigate to . This tab becomes accessible after Ingeniux AI service activation.
Your ChatGPT Key is Active (Private Key)
The Your ChatGPT Key is Active section displays only when the AI system is activated with a private ChatGPT API key. This section indicates the total query count (i.e., AI prompts) that CMS users have ran as a whole during the current month. This number includes the overall total AI prompts that CMS users ran to create or enhance content with AI, no matter whether users chose to apply or not apply the content to the text-based element within the page or component.
The query count, along with the date when the system started tracking the queries, displays in the top-right corner of the Your ChatGPT Key is Active section.

AI Usage
The AI Usage section displays key metrics related to AI activity across your organization.
This section provides the following three areas of AI usage information:
- Content Updates
- Content Fields Updated per User
- Content Fields Updated per Schema
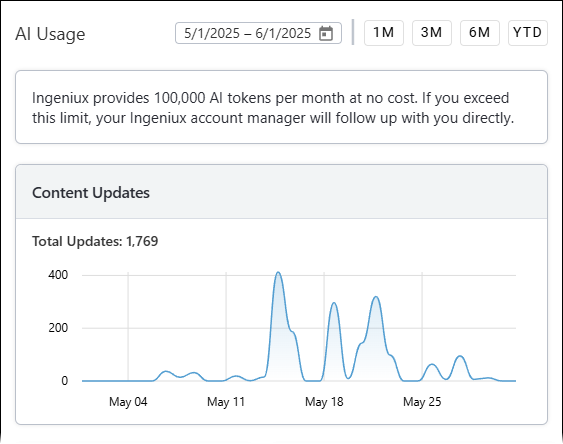
Content Updates
The AI Usage section provides a visual Content Updates spline chart, indicating the total number of updates made to fields with AI-generated content. In this case, updates refer to when users generate content with AI and then apply their changes to the field within the content item. If users generate content with AI but don't apply the content to the field, then those instances are discounted from the updates total count.
Review the spline chart to see when users apply generative AI updates to text-based elements over a period of time. The x-axis indicates the date, and the y-axis indicates the total updates made. Use the date picker tools in the top-right corner of the AI Usage section to specify a time frame for the spline chart to highlight. Available time frame options include:
- Custom
- Choose a custom date range with the calendar date picker tool.
- 1M
- Past month.
- 3M
- Past three months.
- 6M
- Past six months.
- YTD
- Past year.

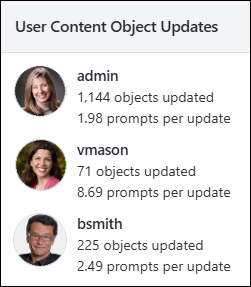
User Content Object Updates
The User Content Object Updates area indicates which users applied AI-generated content to text-based elements. For each respective user, the data indicates the following:
- User ID.
- Total times the user applied AI content to fields (i.e., text-based elements in pages and components).
- Average number of prompts the user runs before applying AI-generated content to the
object (i.e., average number of queries per update).NoteThe number of prompts per update value uses the following formula:
queries ÷ updates = number of prompts per update
In other words, the total number of prompts the user sent to ChatGPT divided by the total times the user applied AI-generated content to elements will equal the average number of prompts the user sends per AI content submission.

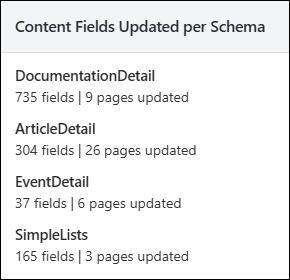
Content Fields Updated per Schema
The Convent Fields Updated per Schema area indicates AI usage in fields associated with individual page and component schemas. For each entry, this data indicates the total number of fields where users applied AI-generated content to pages or components associated with a schema.

