Turning on Debug Mode
DITA users with permissions to publish DITA sets can turn on debug modefor DITA-OT post-publish processing. This mode allows more information to be written to the publishing logs, including verbose logging, details on Java classes, additional Ant properties and overrides, preprocessing filters, parameters, and stages, and the complete build sequence.
When previewing or publishing DITA for the first time, it's a good idea to enable debug mode in case you need to troubleshoot either of these operations.
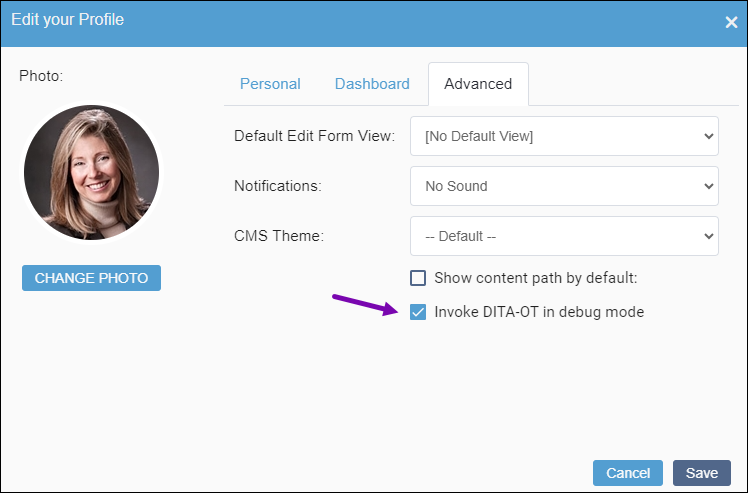
To enable debug mode:
- Select the Invoke DITA in debug modecheckbox.
Next Steps:
After your preview or publish operation completes, navigate to . The Post Processing Status Console displays.
In this dialog, you can download log files containing additional debug information. For those DITA maps that contain errors, you can download the DITA-OT temp folder for the associated DITA map, which may help you troubleshoot the issue.
If you clear the Invoke DITA-OT in debug modecheckbox, then the temp log download column will not display in the Post Processing Status Console dialog during post-publish processing.