Prerequisites: System administrators must enable debug mode (
args.debug) before users run the
DITA preview. See
Running DITA Debug Mode for
details.
Note
The system provides debugging details in the DITA log after the associated
DITA preview runs with debug mode enabled.
Check the DITA preview log for errors. These errors may provide details about where the
conflict resides and what the conflict entails. You can check the DITA preview log in two
areas.
To check a DITA log for errors via the DITA Preview or
XML tab:
- Navigate to , and choose one of the following steps.
Important
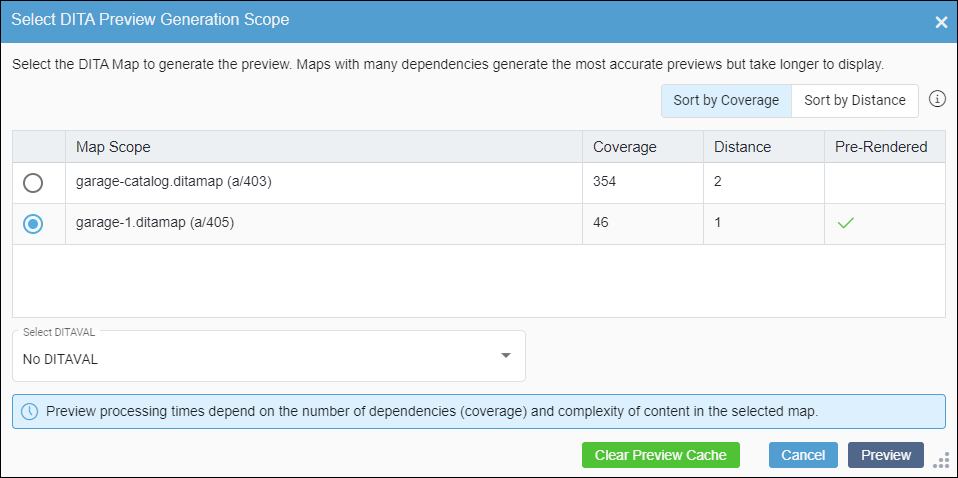
If the preview map scope contains cached previews, then clear the
cache before executing the preview. See
Clearing DITA Preview Cache for details.
Note
The DITA-OT transformation process takes time to generate the DITA preview.
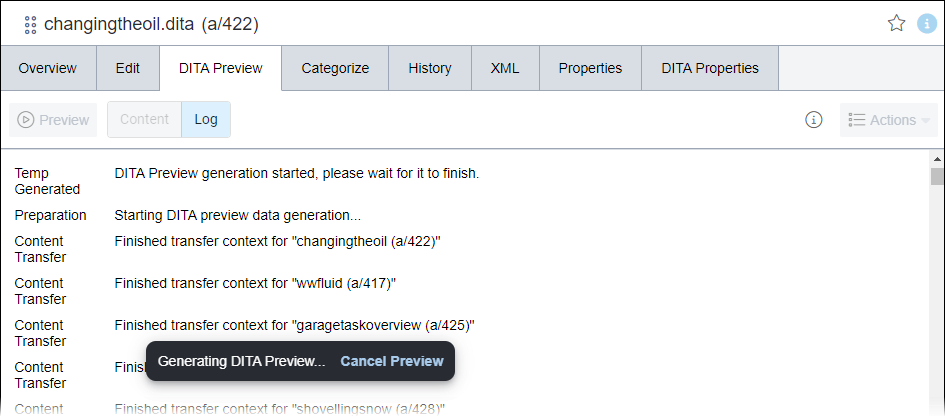
The DITA-OT transformation process executes, and the real-time DITA-OT process
details display in the
Log screen.

- Keep the DITA Preview tab open, and wait for the preview to
generate.
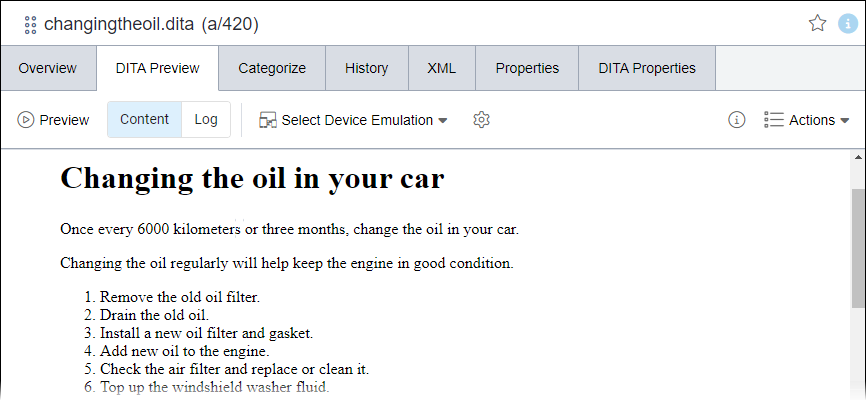
When the process completes, the system displays the
Preview
generated message along with the total build time for the DITA-OT
transformation. Also, the
DITA Preview tab switches to the
Content screen, where the completed DITA asset content preview
displays.

Troubleshooting
If system ran the DITA-OT transformation and the process
does not successfully complete, then the DITA Preview tab remains
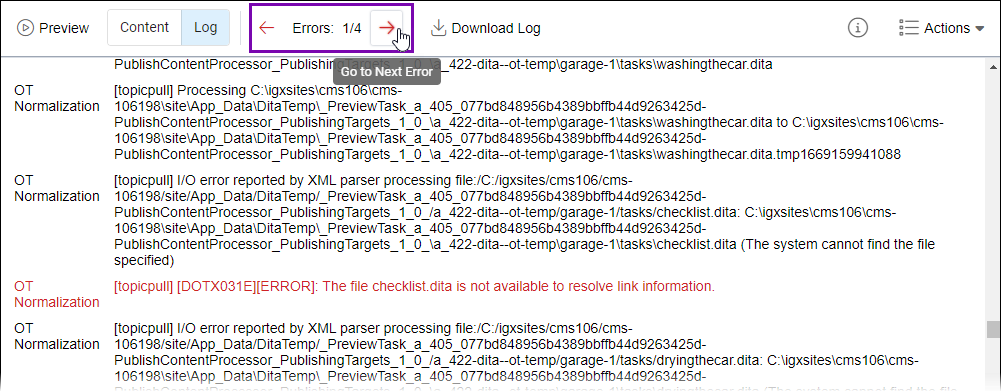
in the Log screen view. and the Errors
navigation tool displays in the DITA Preview tab
toolbar.
- If errors display in the Log screen view, use the toolbar
Error arrows to navigate errors within the log. Select the left
arrow to navigate to the previous error, and select the right arrow to navigate to the
next error. To download the log, follow the step directly below.

- Optional: You can download the transformation log details by completing the following
steps.
- Select the Log option in the DITA
Preview tab toolbar.
The Log screen displays.
- Select Download Log in the DITA
Preview tab toolbar.
- Open the downloaded log file in a text editor.
- Open the downloaded log file in a text editor.
- Review the log data, and note entries that indicate errors or other
discrepancies.
Next Steps:
After noting DITA log errors and other discrepancies, return to the appropriate
troubleshooting topic to continue diagnosing your issue.
To check a DITA log for errors:
- Navigate to , and choose one of the following steps.
Important
If the preview map scope contains cached previews, then clear the
cache before executing the preview. See
Clearing DITA Preview Cache for
details.
Note
The DITA-OT transformation process takes time to generate the DITA preview.
The DITA-OT transformation process executes, and the real-time DITA-OT process
details display in the
Log screen.

- Wait for the DITA-OT transformation to complete, and then navigate to .
Note
When the process completes, the system displays the Preview
generated message along with the total build time for the DITA-OT
transformation.
- Select the Show DITA Logs button in the Recently
Completed section of Publishing Monitor to access
the preview log for the most recently executed DITA preview transformation
process.

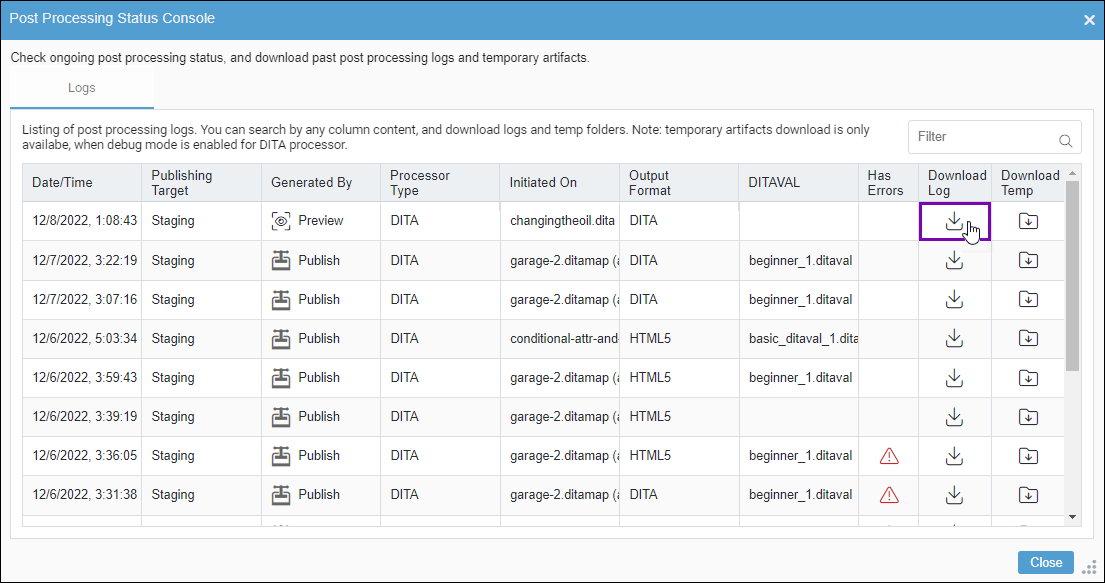
The Logs tab of the Post Processing Status
Console dialog displays.
- Review the relevant preview entry, and note if the Has Errors
column indicates conflicts.
Important
The Has Errors column only indicates
conflicts when the DITA-OT transformation process encounters a fatal error that halts
the entire process. If the Has Errors column indicates no
conflicts, the log may still contain errors and warnings that did not halt the DITA-OT
process.
- Select the Download Log icon associated with your
preview.

The system downloads the .log file to your local
machine.
- Open the downloaded log file in a text editor.
- Review the log data, and note entries that indicate errors or other
discrepancies.
Next Steps:
After noting DITA log errors and other discrepancies, return to the appropriate
troubleshooting topic to continue diagnosing your issue.

